RIS RTM Documentation
Overview
What is RTM?
IBM® Spectrum LSF RTM (RTM) is an operational dashboard for IBM Spectrum LSF environments that provides comprehensive workload monitoring, reporting, and management. It makes cluster administrators more efficient in their day-to-day activities and provides the information and tools that are needed to improve cluster efficiency, enable better user productivity, and contain or reduce costs.
How to Access RTM
You can access RTM for the RIS Compute Platform at the following link.
How to Login
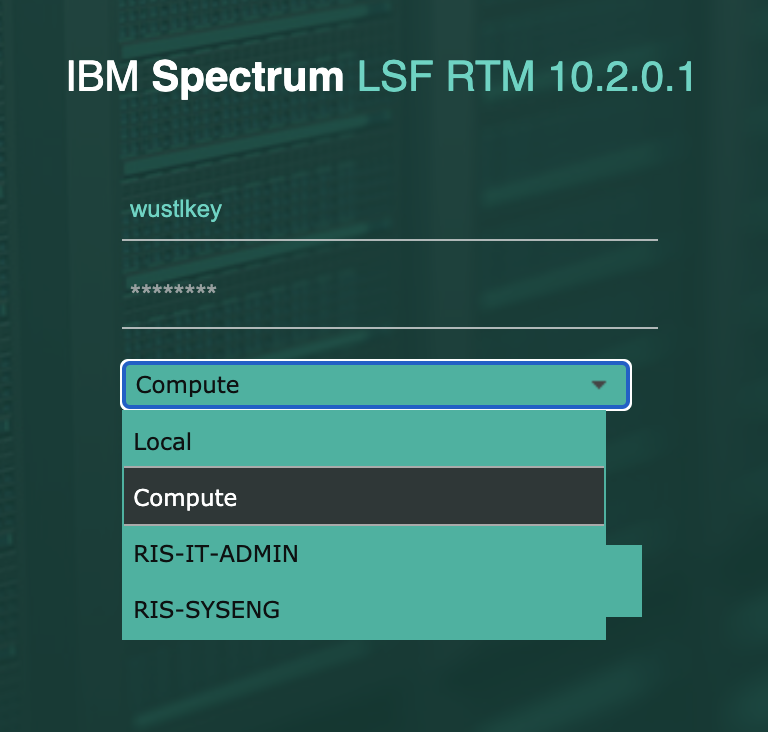
You will use your Wustlkey and password to login to RTM.
There are multiple options to choose from on login, most users will want to use the Compute login.
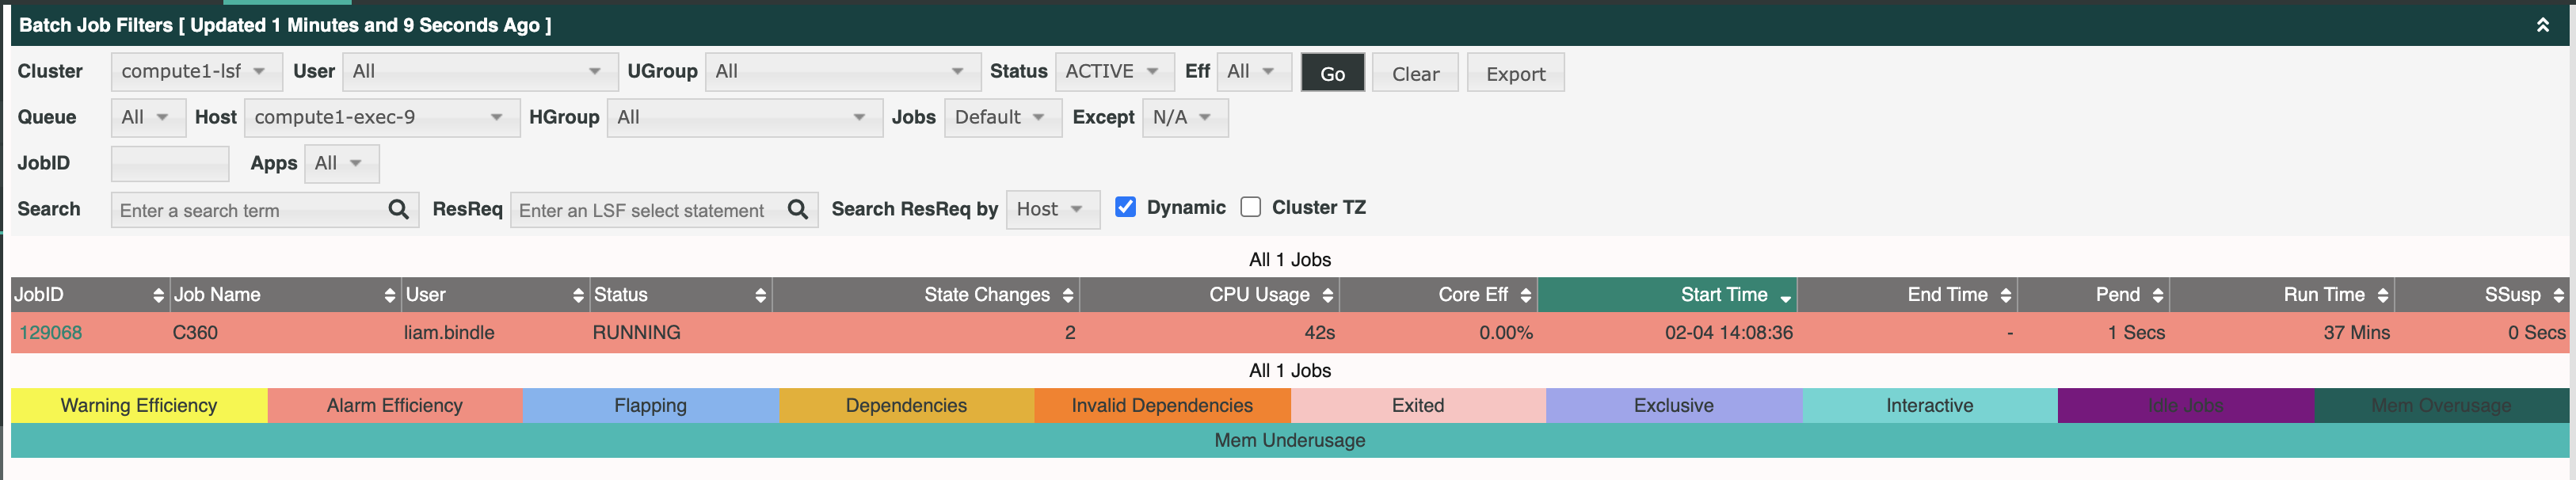
RTM Dashboard
Cluster Dashboard
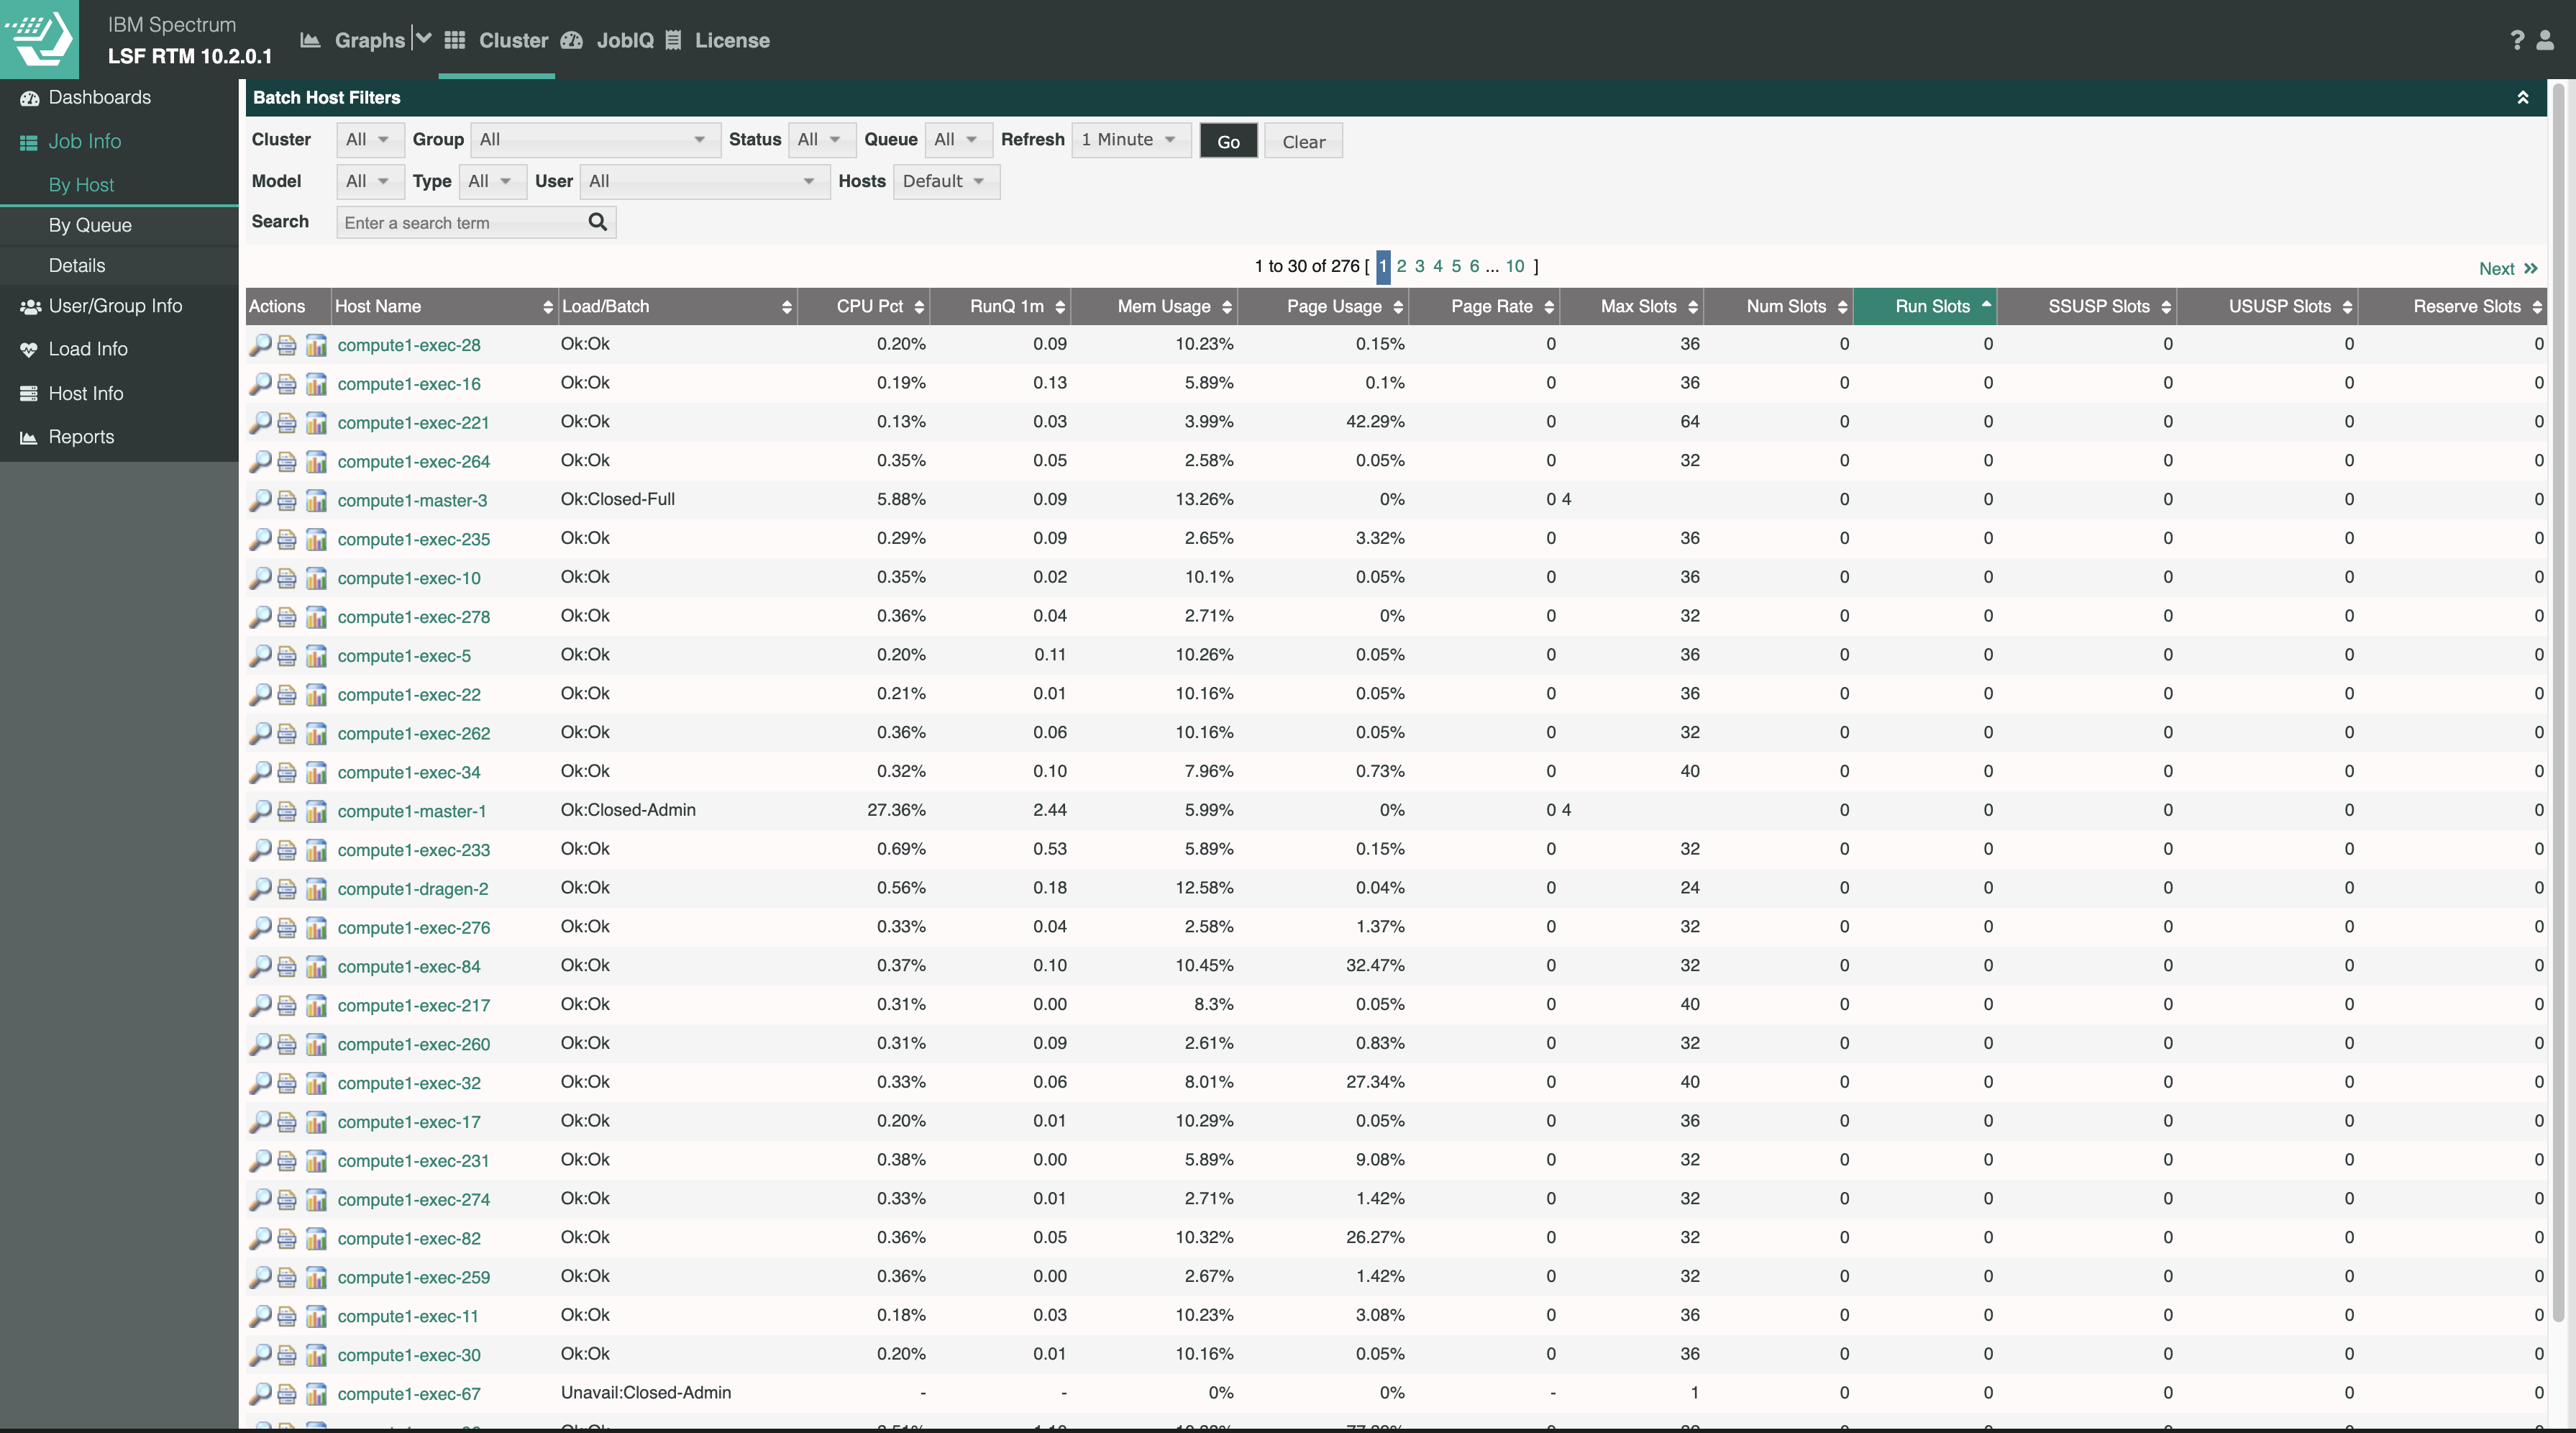
This dashboard contains information for all the the execution nodes (hosts).
This is where users can search jobs by user, JobID, queue, processor model and type, and status of the execution node (host).
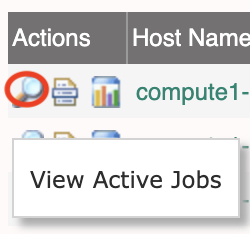
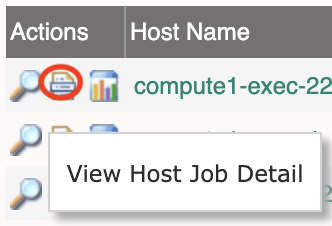
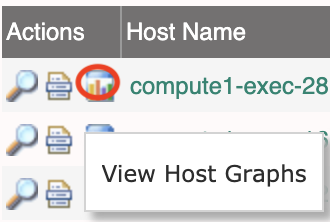
- Actions
View Active Jobs: Shows the basic details of job running on the execution node.
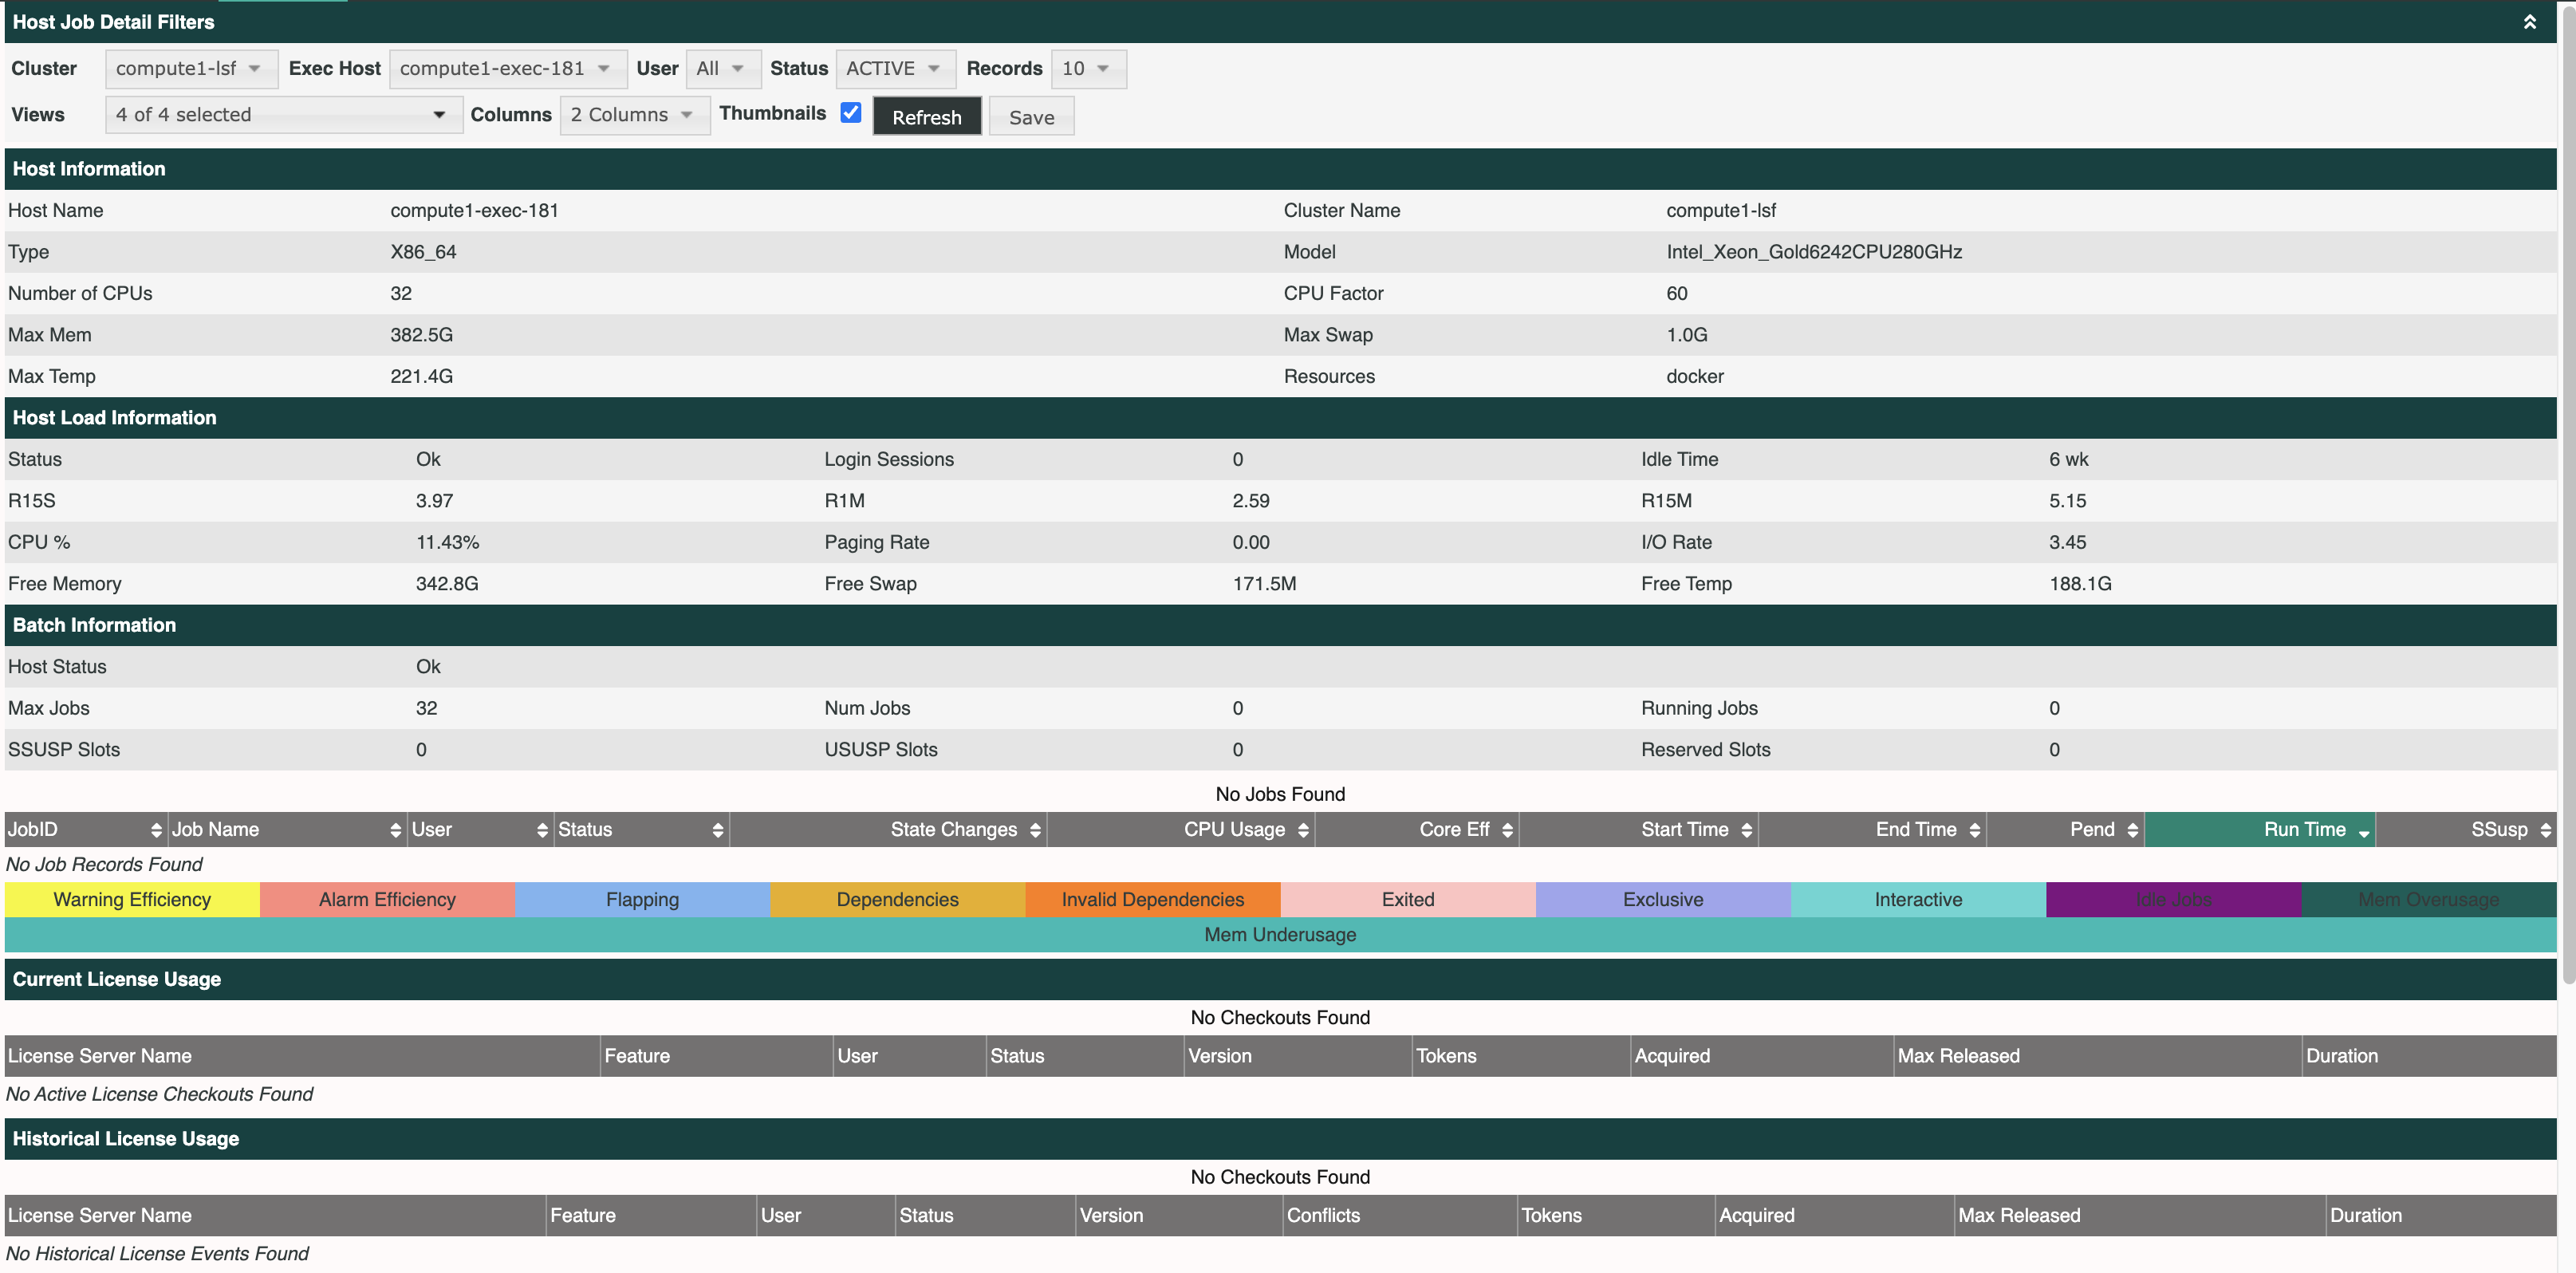
View Host Job Detail: Shows the details of the execution node (host) itself.
View Host Graphs: Shows graphs of usage of the execution node (host).
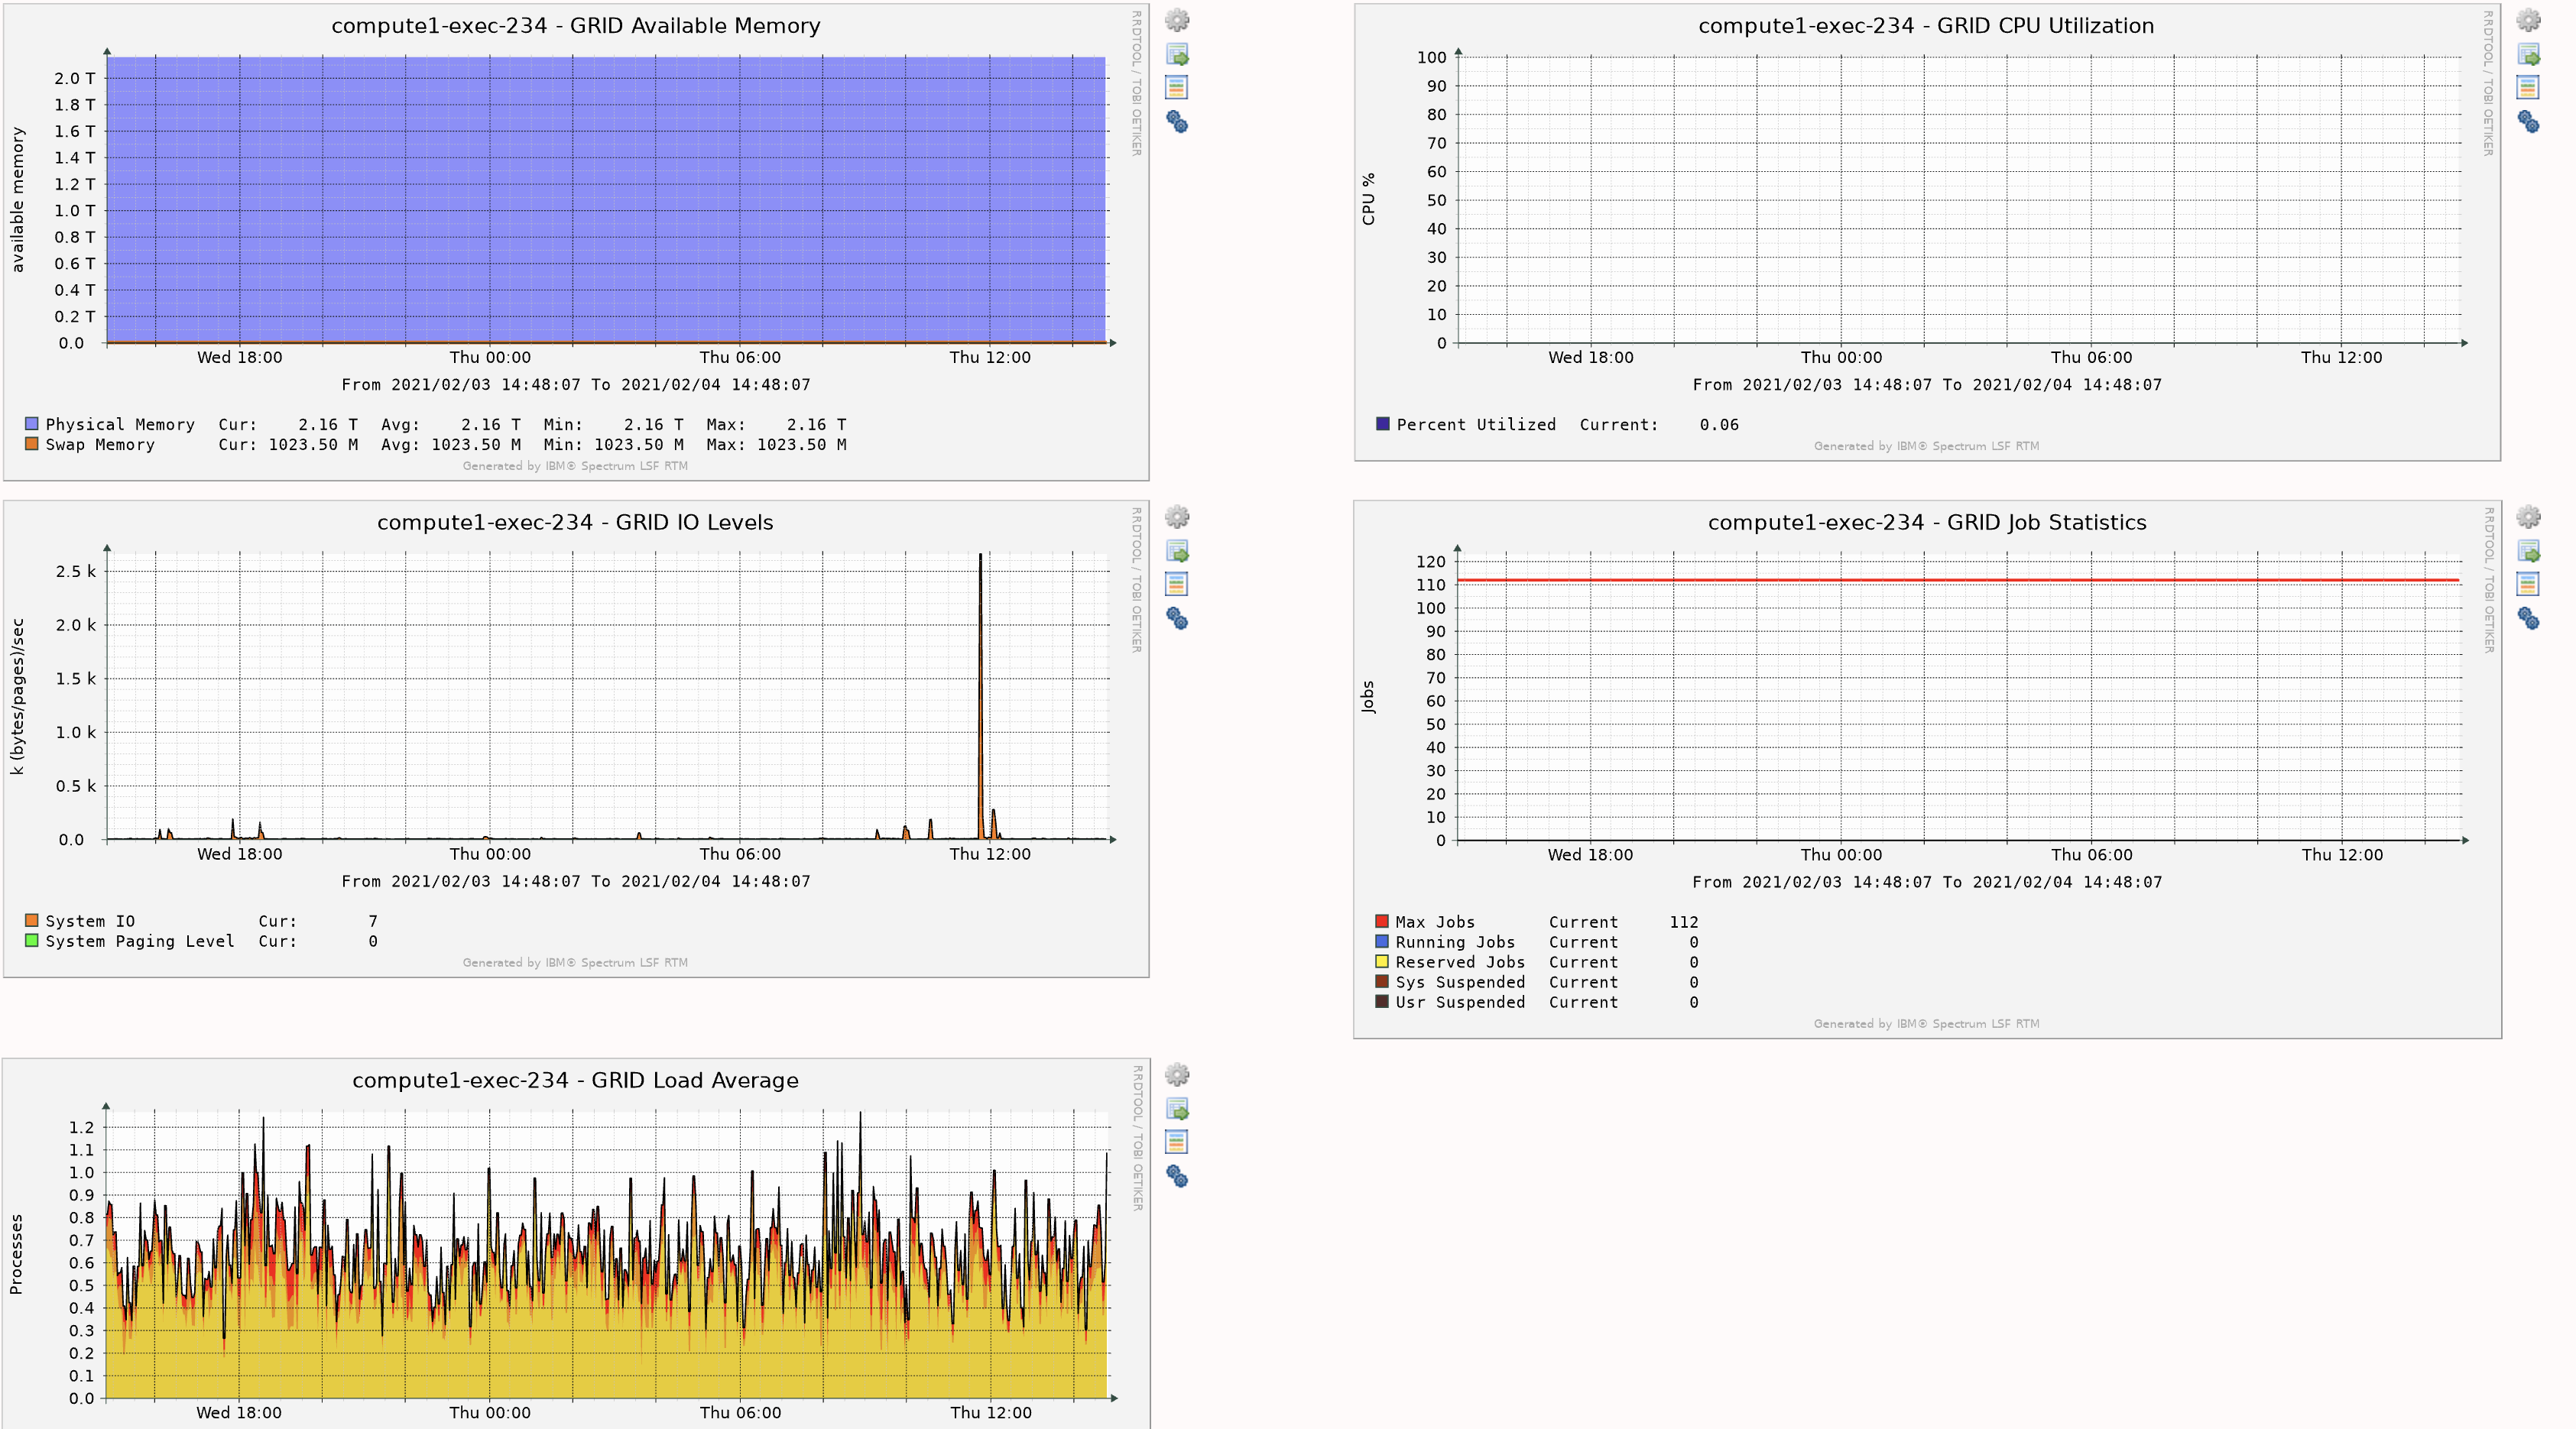
- Details
Actions: Detailed above.
Host Name: The LSF execution node (host) name.
Load/Batch: The status of the execution node (host).
CPU %: The execution nodes’s (host’s) overall CPU utilization rate, as a percentage.
RunQ 1m: The exponentially-averaged effective CPU run queue length for this execution node (host) over the last minute.
Mem Usage: The execution node’s (host’s) memory usage, as a percentage.
Page Usage: Page usage of all jobs running on this execution node (host).
Page Rate: Page usage of all jobs running on this execution node (host) as a percentage of total page size.
Max Slots: The maximum number of job slots on the execution node (host).
Num Slots: The number of job slots in use.
Run Slots: The number of job slots with a running job.
SSUSP Slots: The number of job slots with system suspended jobs.
USUSP Slots: The number of job slots with user suspended jobs.
Reserve Slots: The number of job slots that have been reserved.
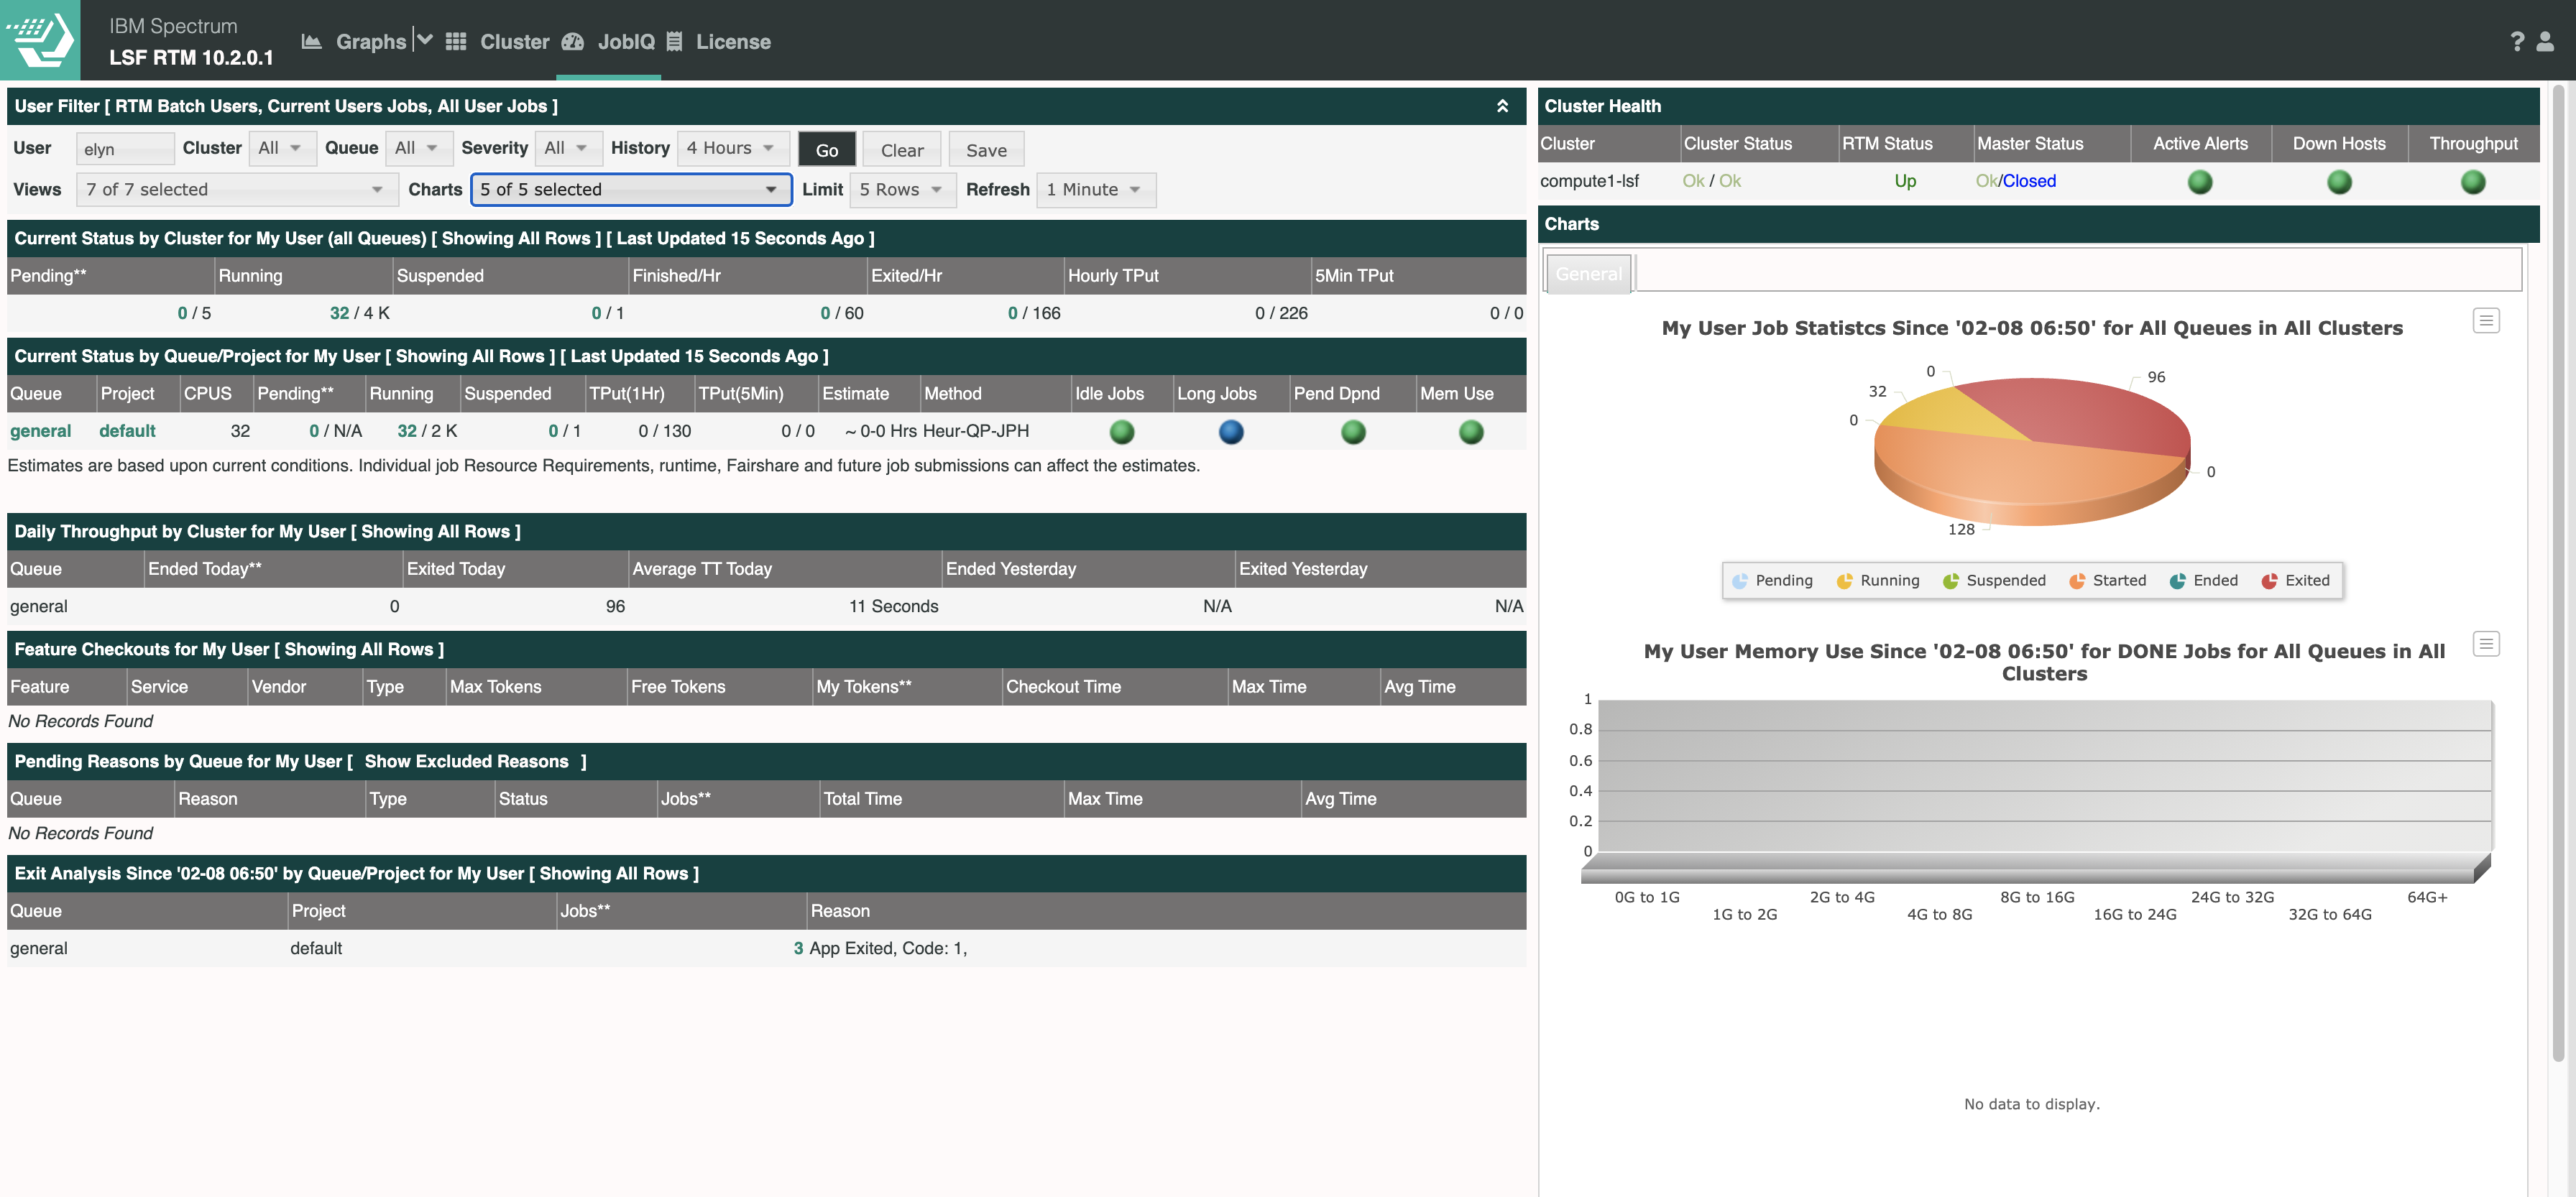
JobIQ Dashboard
This dashboard contains information about your current and recent jobs.
This is an alternative place to monitor job progess beyond using
bjobs.- The lefthand side lists the detailed information for all current and recent jobs.
Current Status by Cluster for My User: This shows a summary of all jobs running on the compute platform.
Current Status by Queue/Project for My User: This shows a summary of all jobs running by queue.
Daily Throughput by Cluster for My User: This gives a summary of all jobs that have ran or are queued/running for the day.
Feature Checkouts for My User:
Pending Reasons by Queue for My User: This gives a summary of all jobs that have the Pending status and the reason for the status.
Exit Analysis Since ‘XX-XX XX:XX’ by Queue/Project for My User: This gives a summary of all exited jobs since ‘XX-XX XX:XX’.
The righthand side shows graphs summaries of some of the information on the lefthand side.
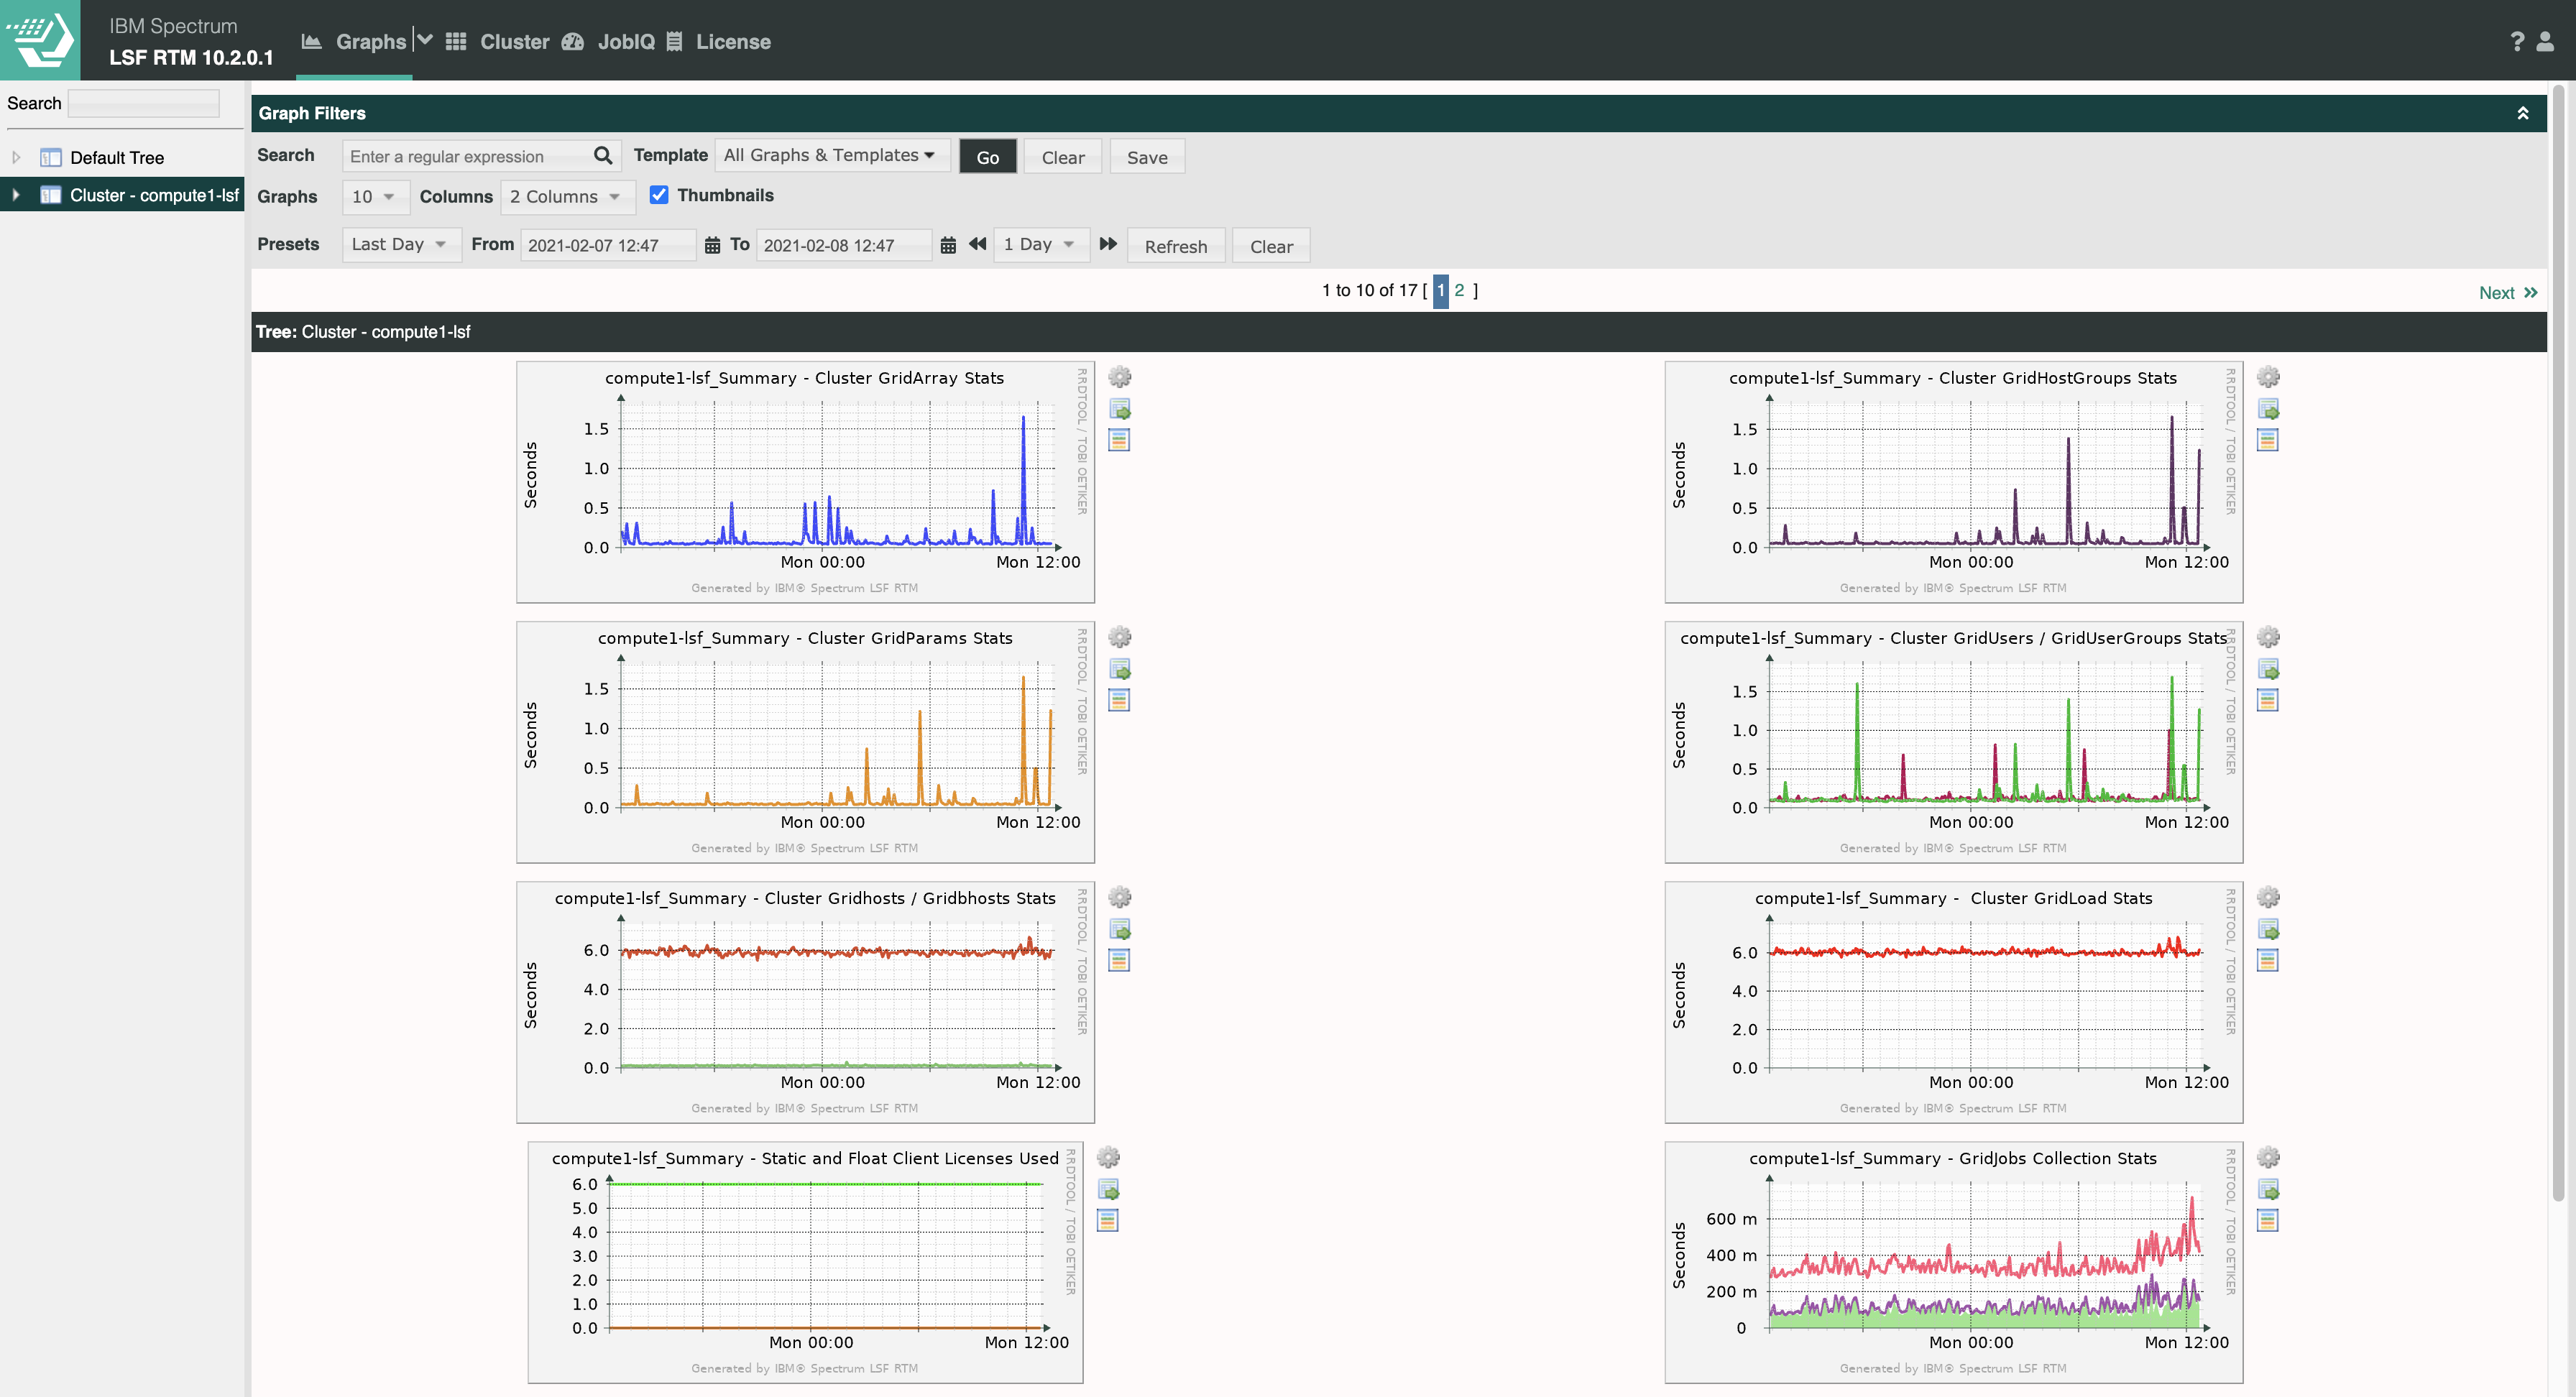
Graphs Dashboard
This dashboard contains graphs of the summary of different statistics related to the compute platform as a whole.
If you click the ‘Cluster - compute1-lsf’, you will see the graphs.
At the top of the page in Graph Filters, there are multiple options to search and adjust the graphs.
License Dashboard
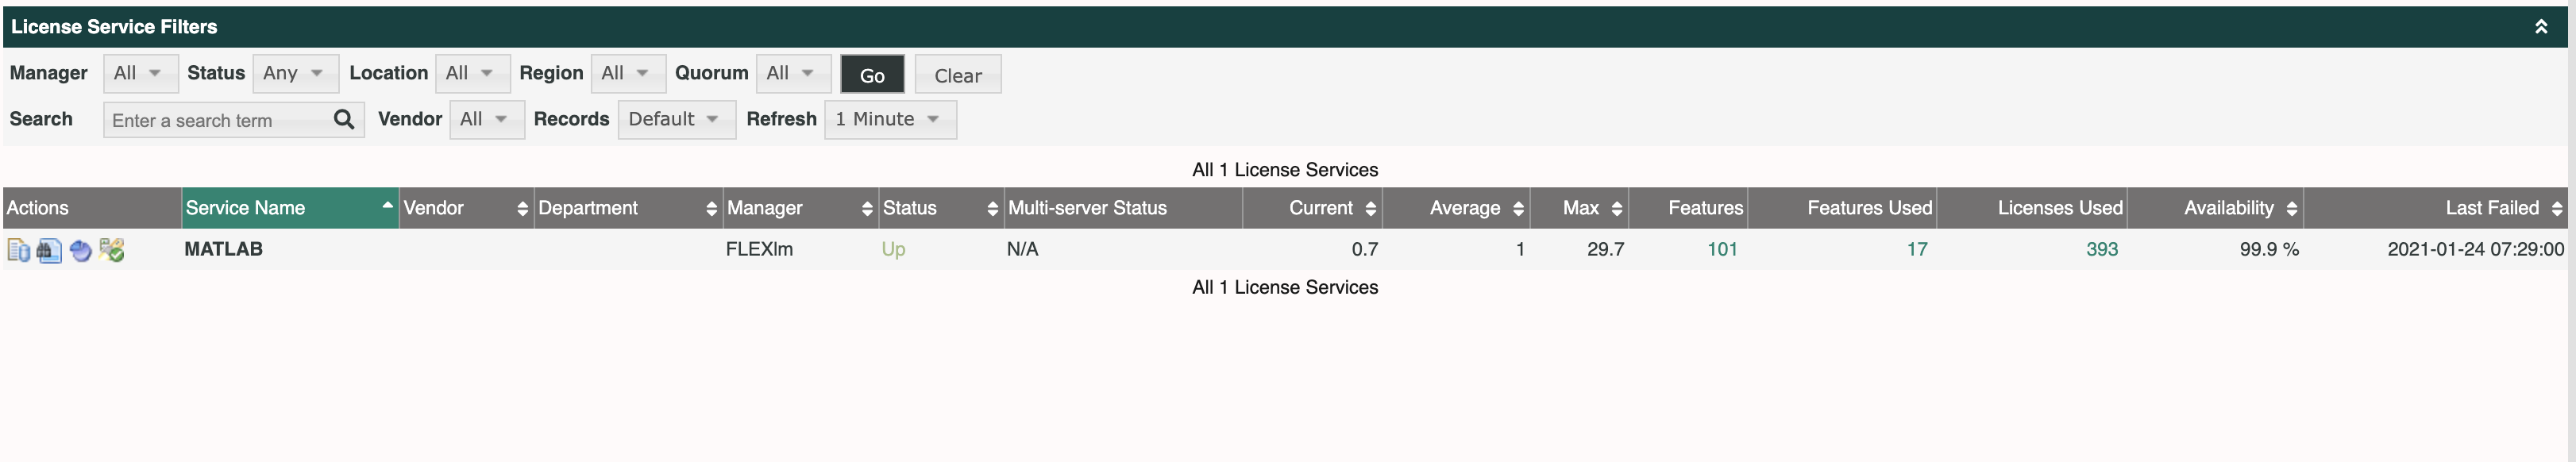
This dashboard contains the licenses that are available for use on the compute platform.
Some users have private licenses stored in other methods, but this contains the RIS supported licenses available.
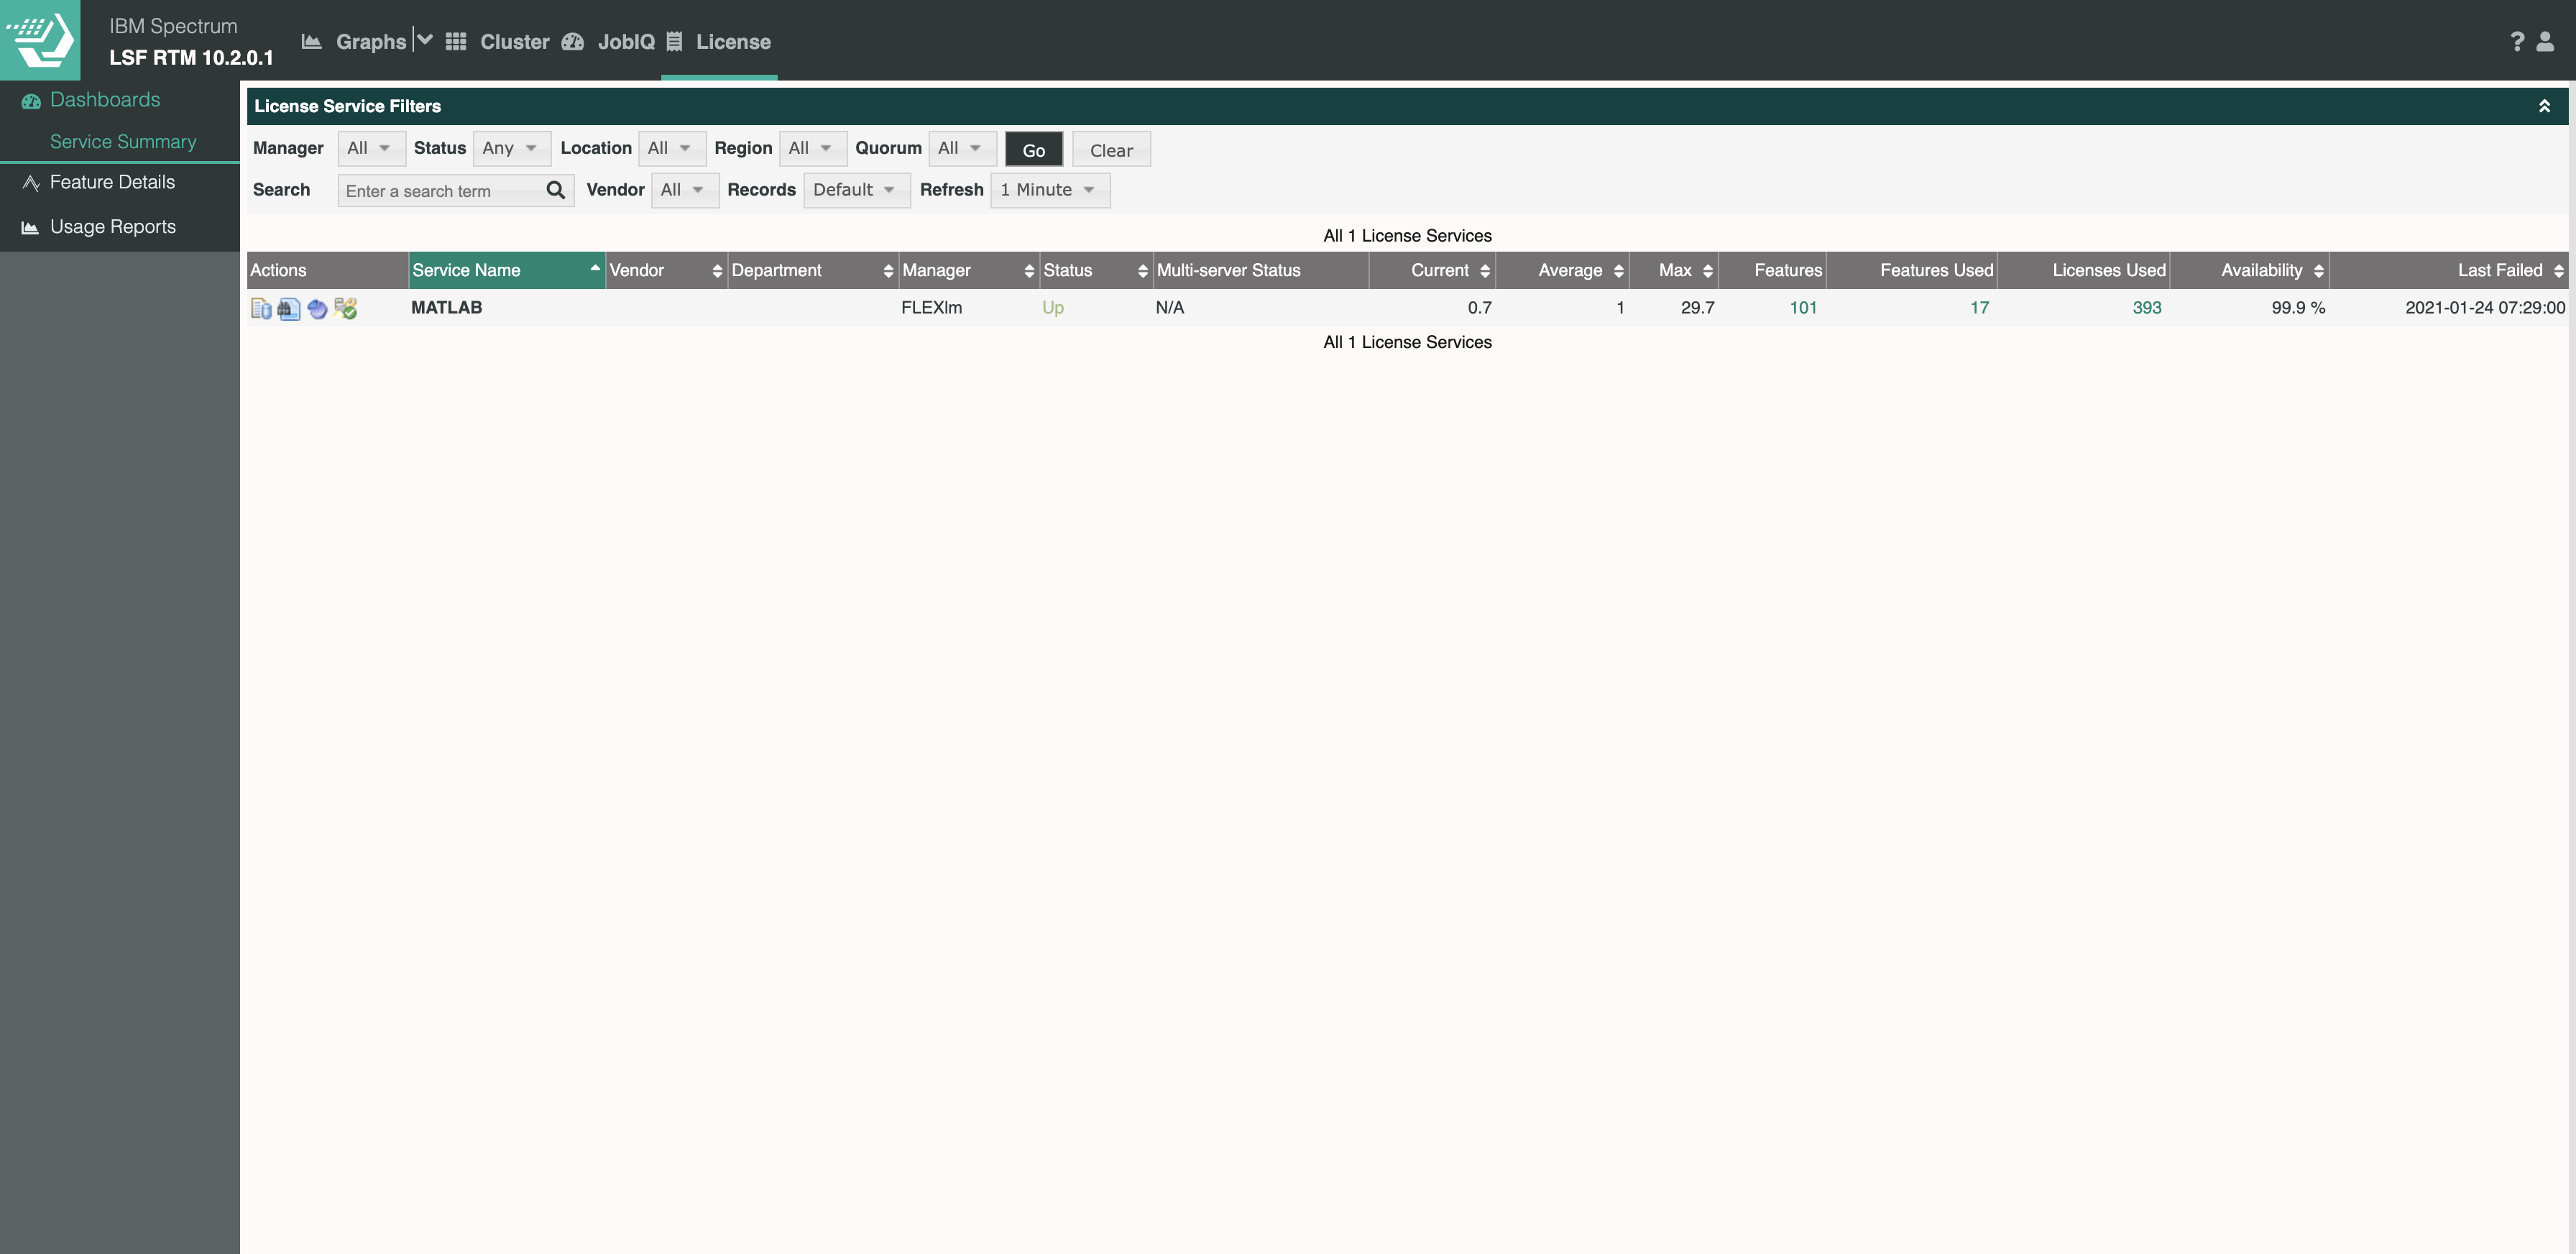
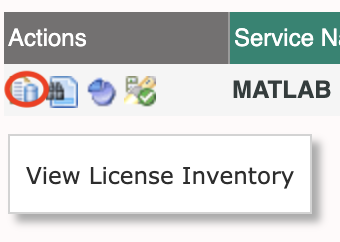
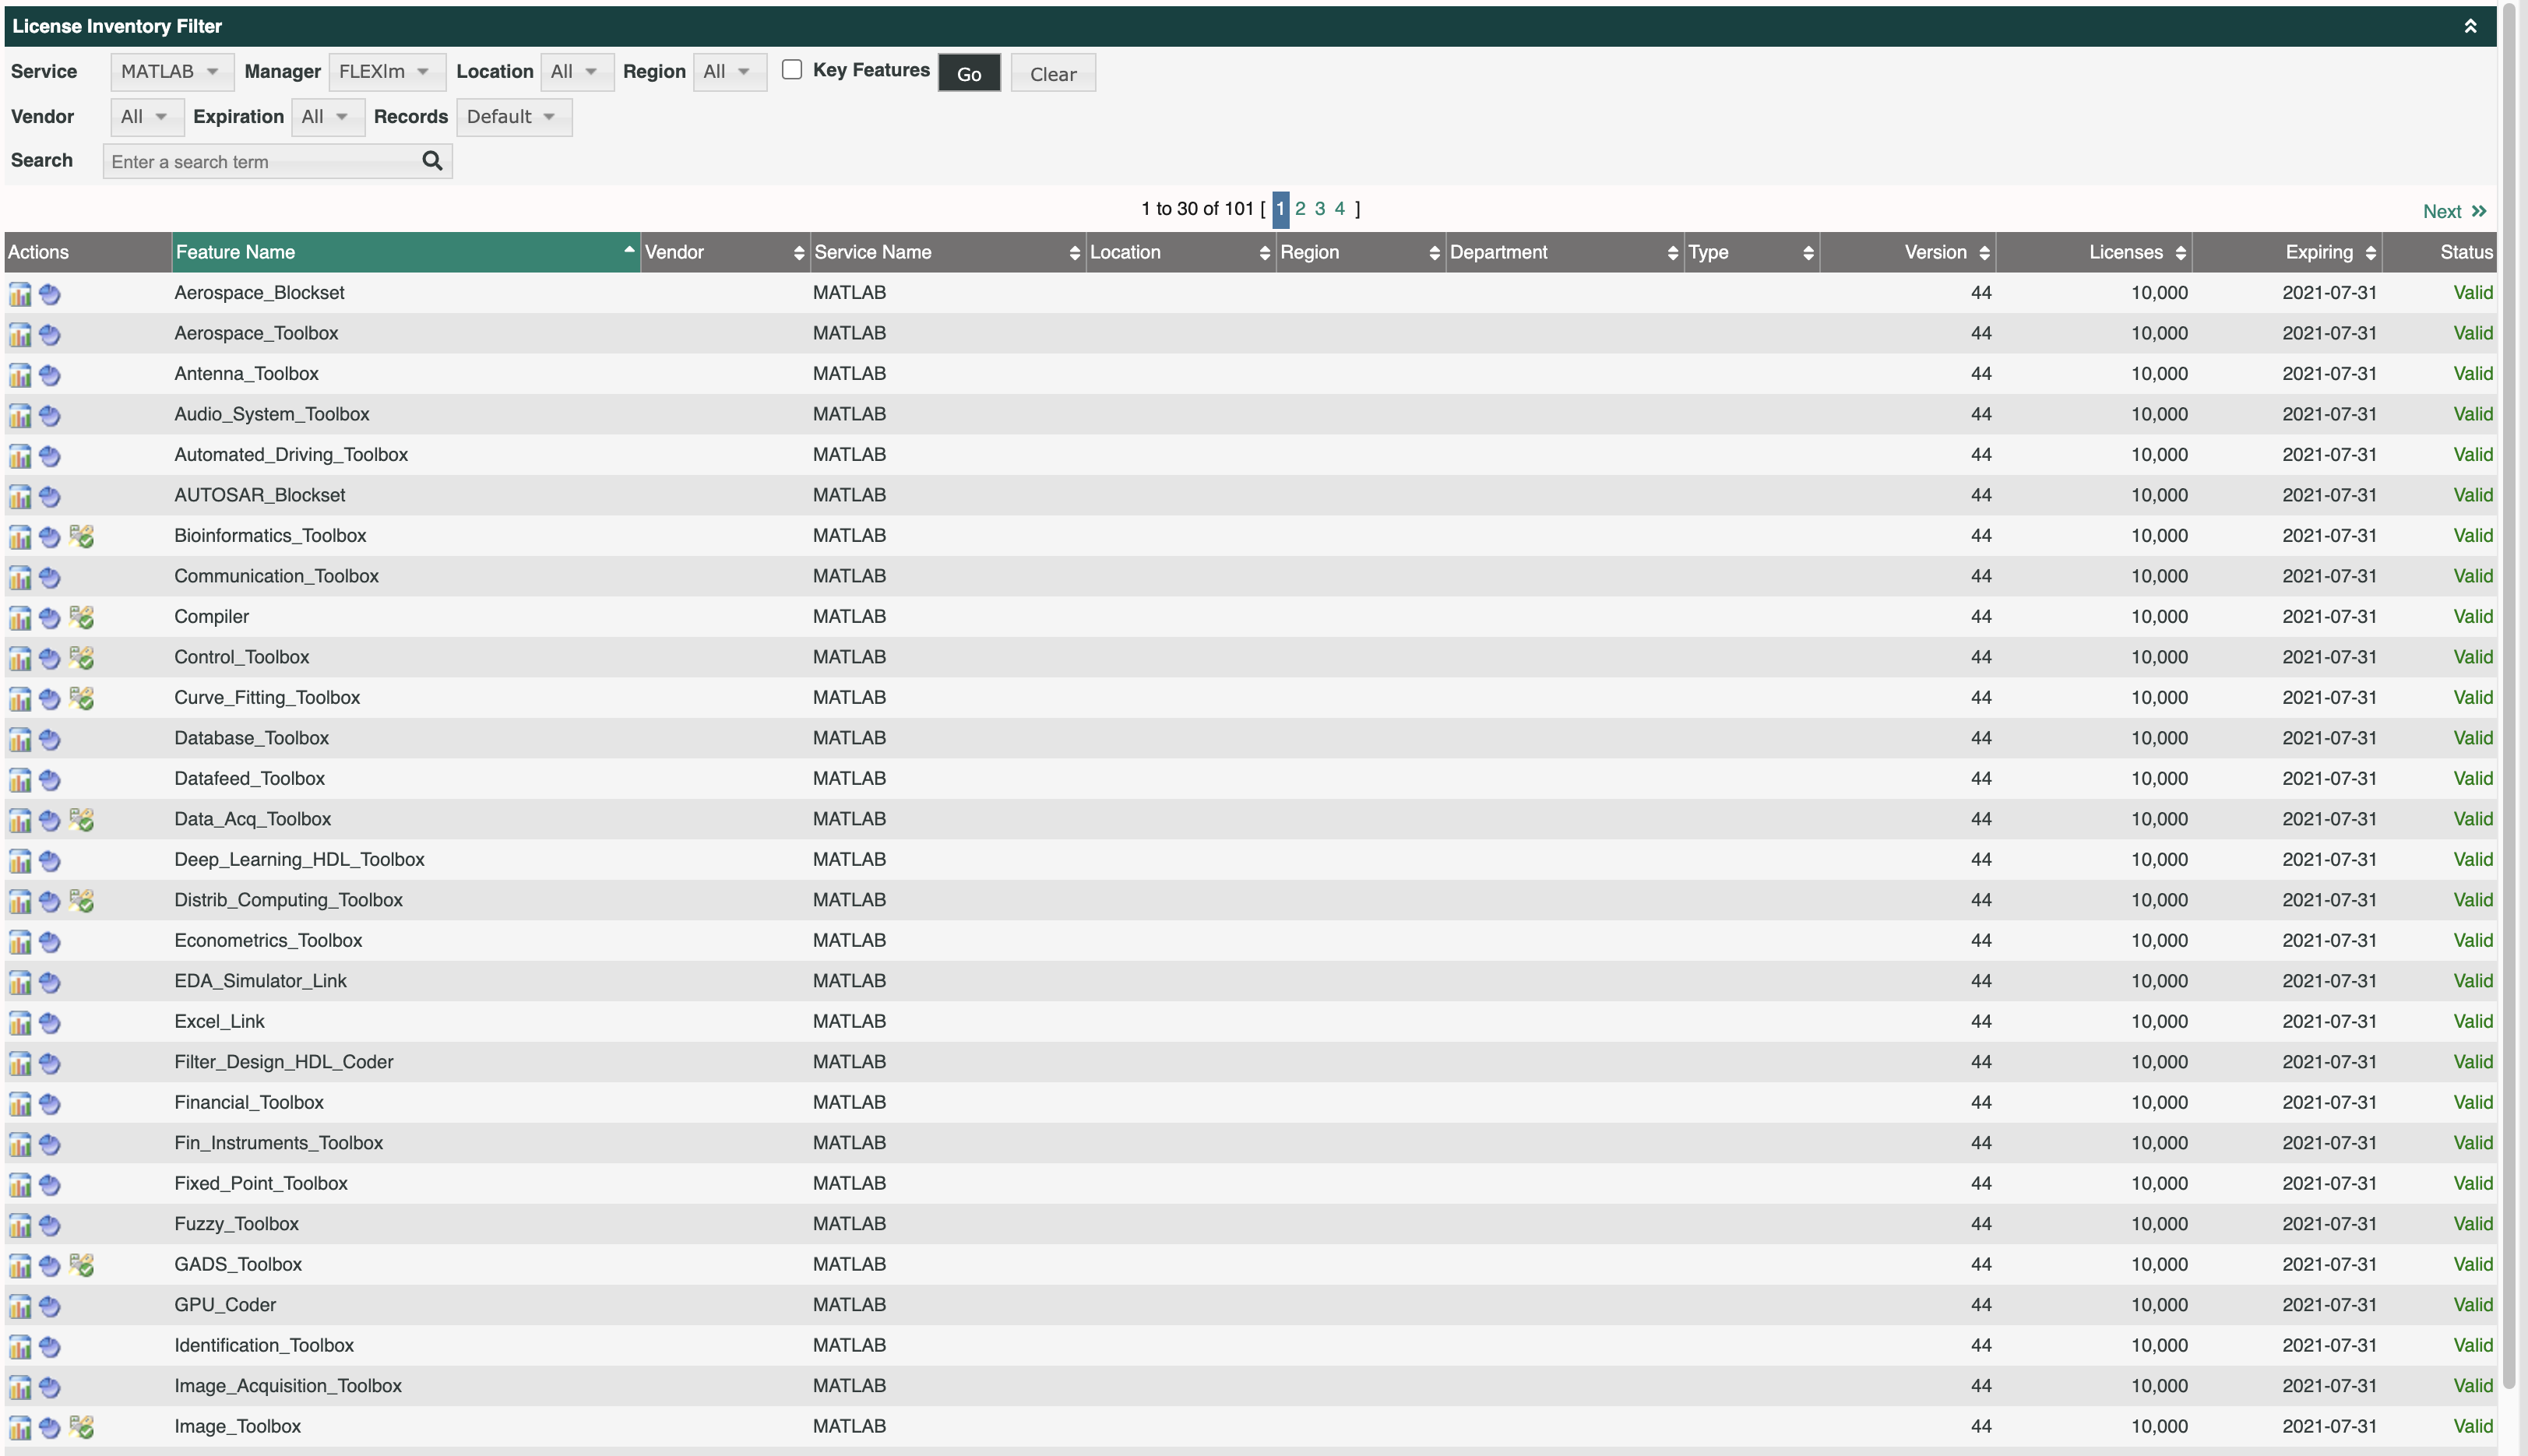
- Actions
View License Inventory: This shows all the features included in the license.
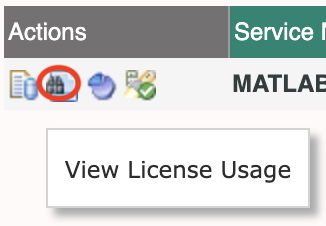
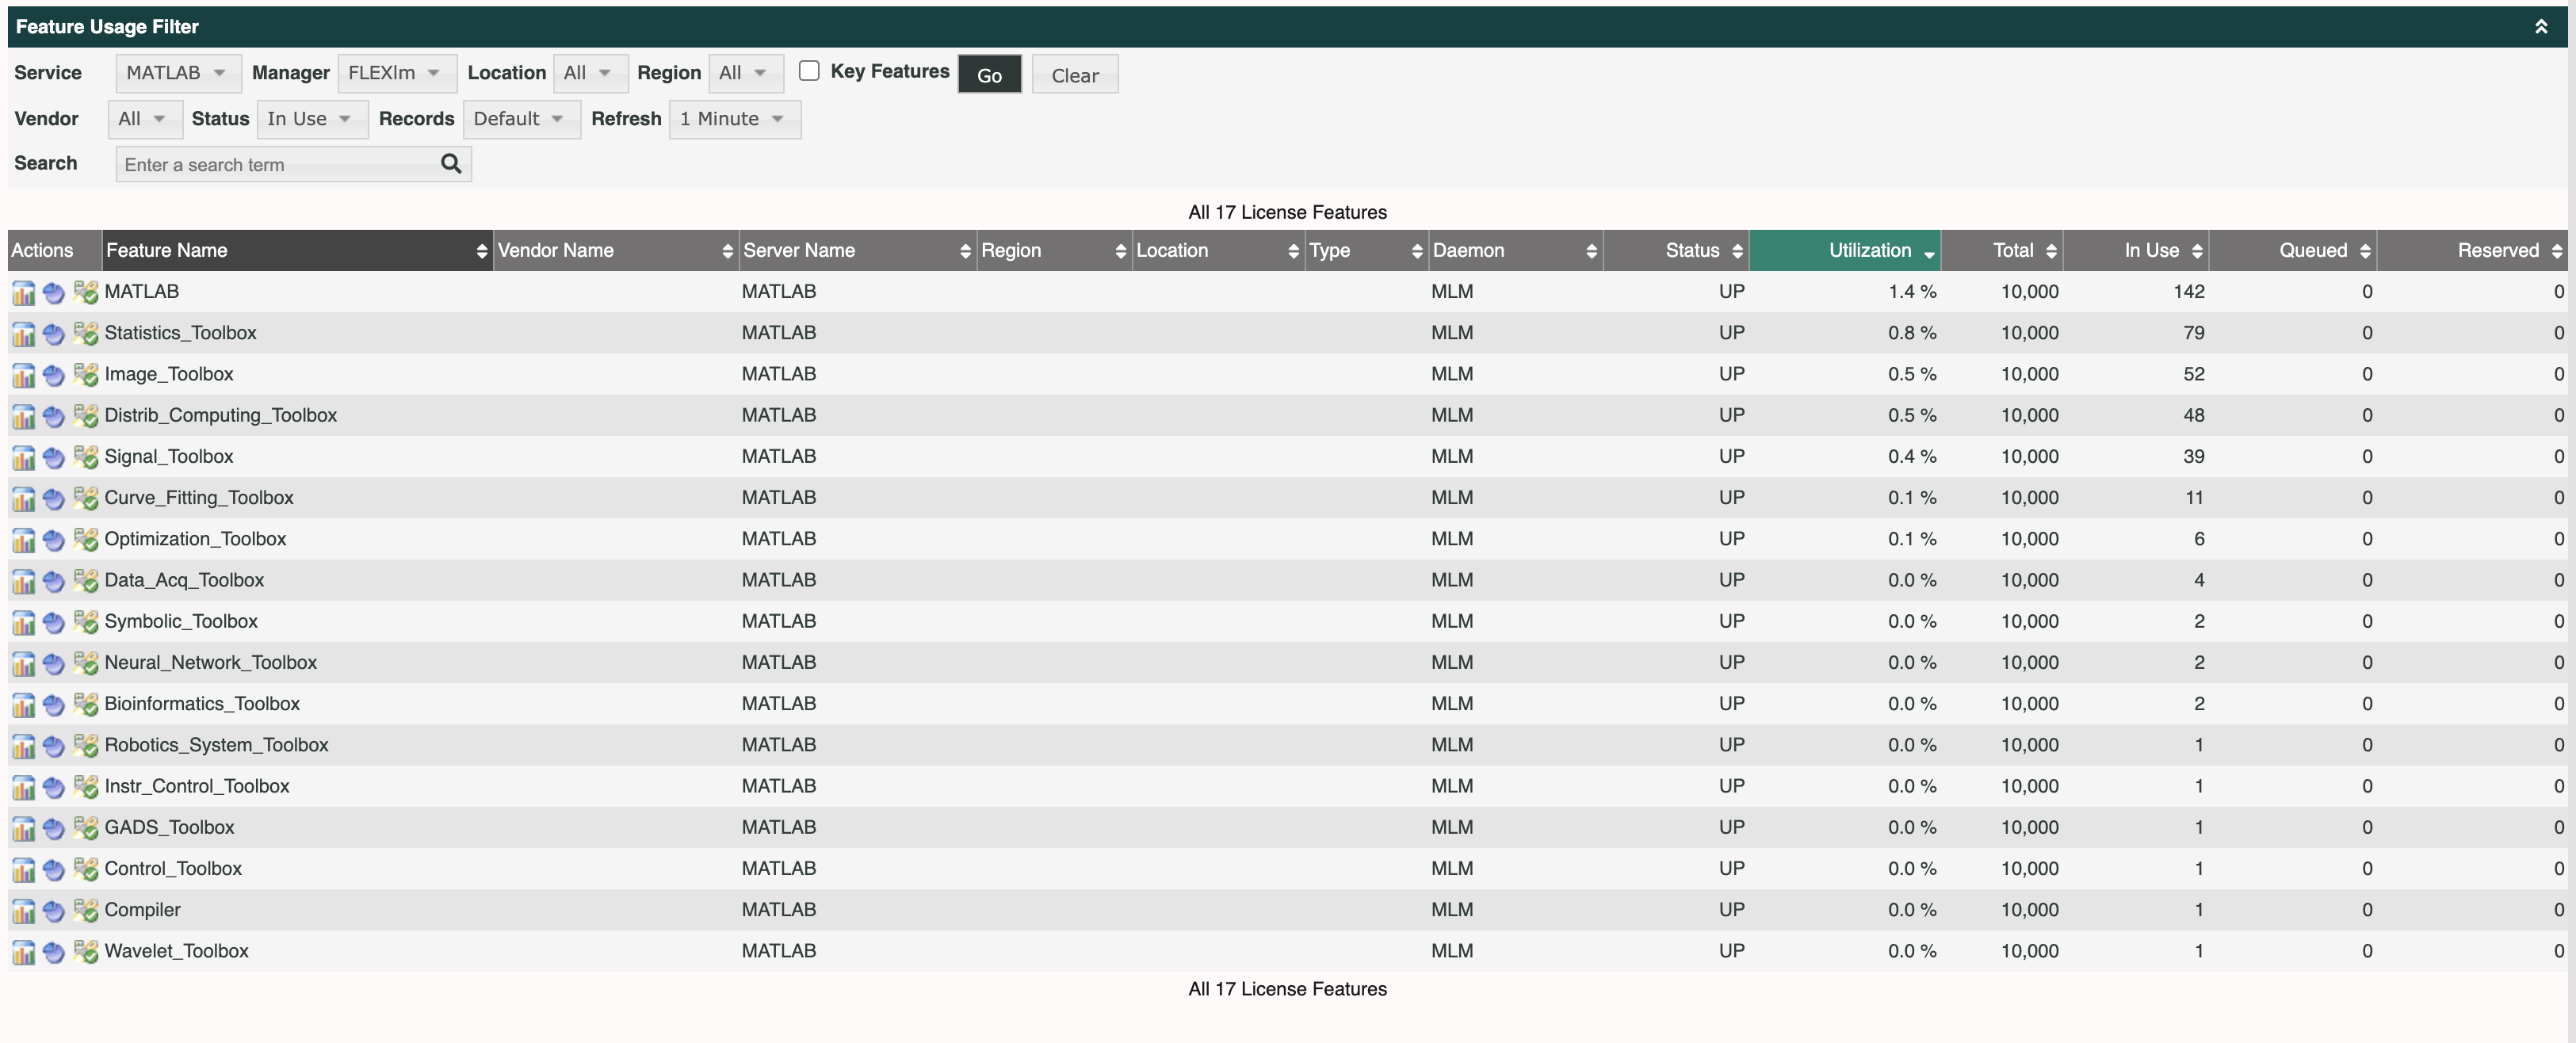
View License Usage: This shows which feature licenses are in use and how many of the total licenses are used.
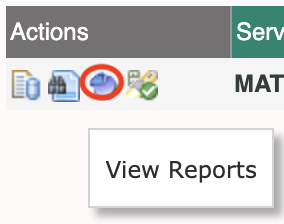
View Reports: This is the main license page you land on that shows a summary of all available licenses.
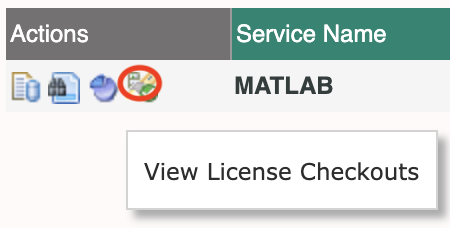
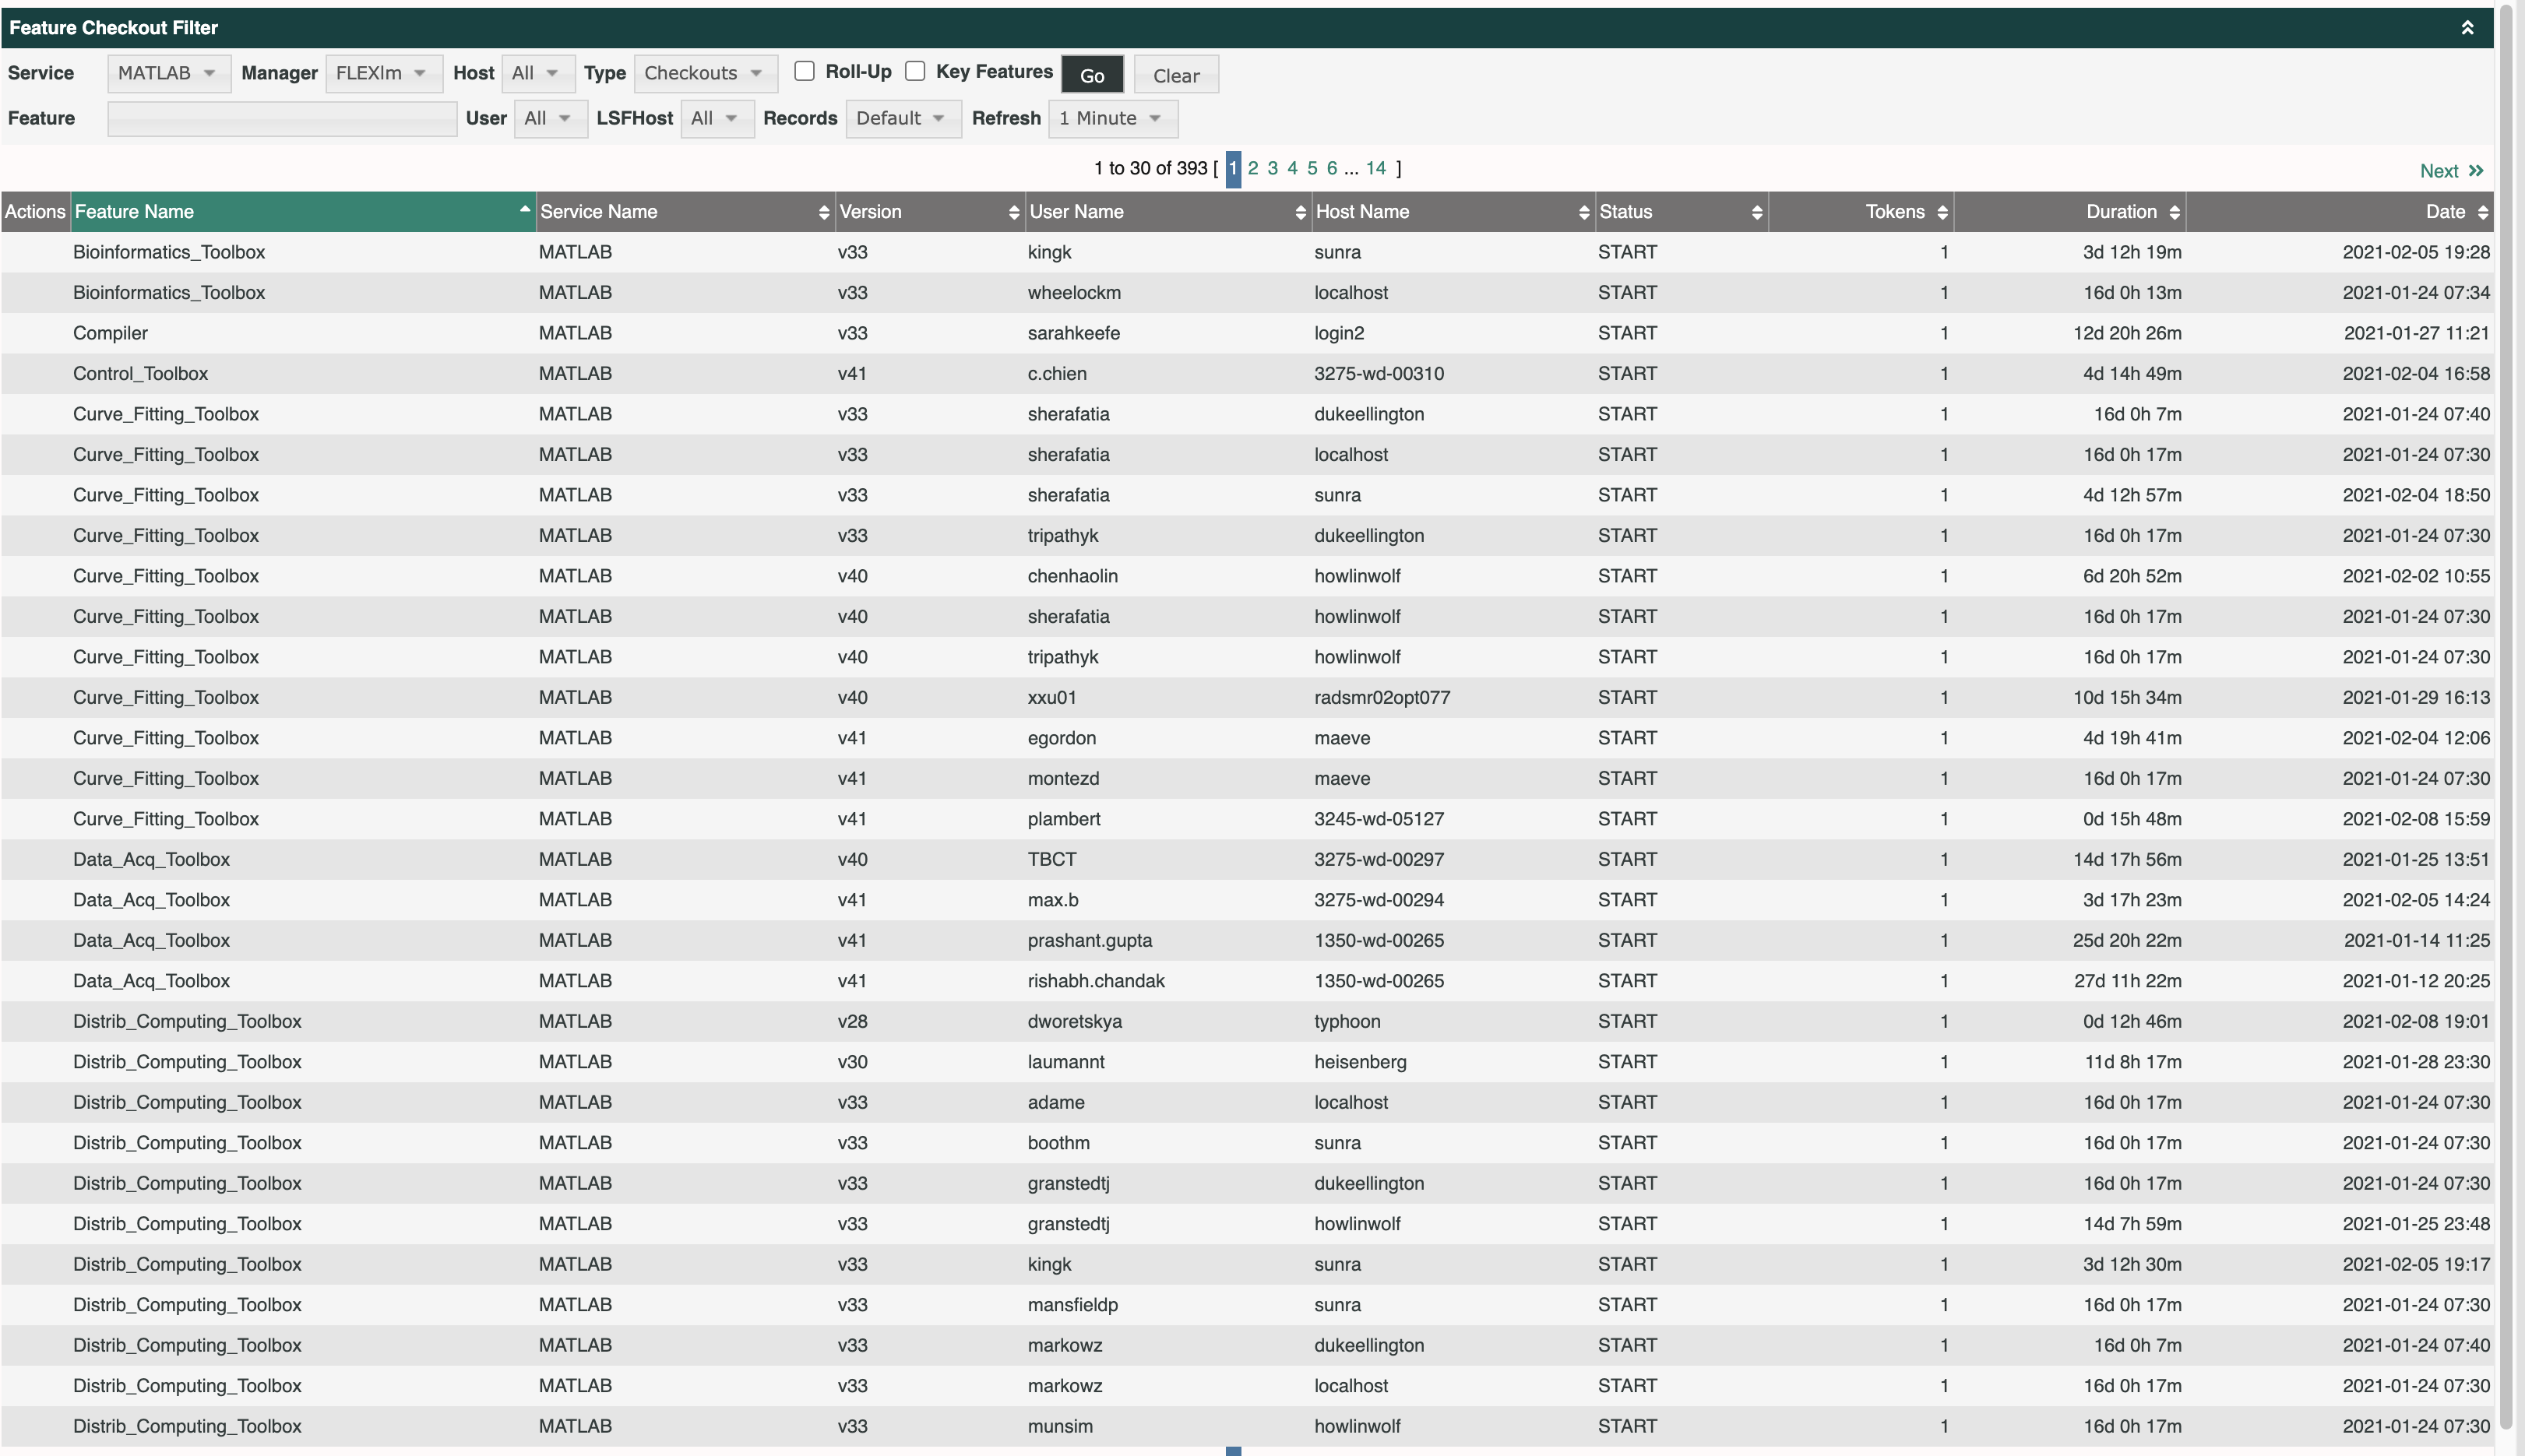
View License Checkouts: Comprehensive list of the checkouts of the license including user, duration, and date.